Updates:
Public Safety Message from the Chief of Police August 2018. Click here
OC Register Article on Laguna Beach City Crime. Click here
SpotCrime Map Laguna Beach. Click here
City Manager Crime Report 2018. Click here
Additional City Crime Comparison information can be found here
Crime Statistical Report by Michael Morris, Laguna Beach Resident 2017
Laguna’s public safety personnel often claim that they simply don’t have the staffing to meet the demands placed on them. When residents’ complain of increases in property crimes, the reply is often that there simply aren’t enough personnel to patrol neighborhoods more often. Also, the go-to boogeyman is often the oft mentioned “6 million tourists” per year that place such a burden on our public safety personnel and inflate the city’s public safety costs relative to other OC cities, making them seem so extraordinarily high.
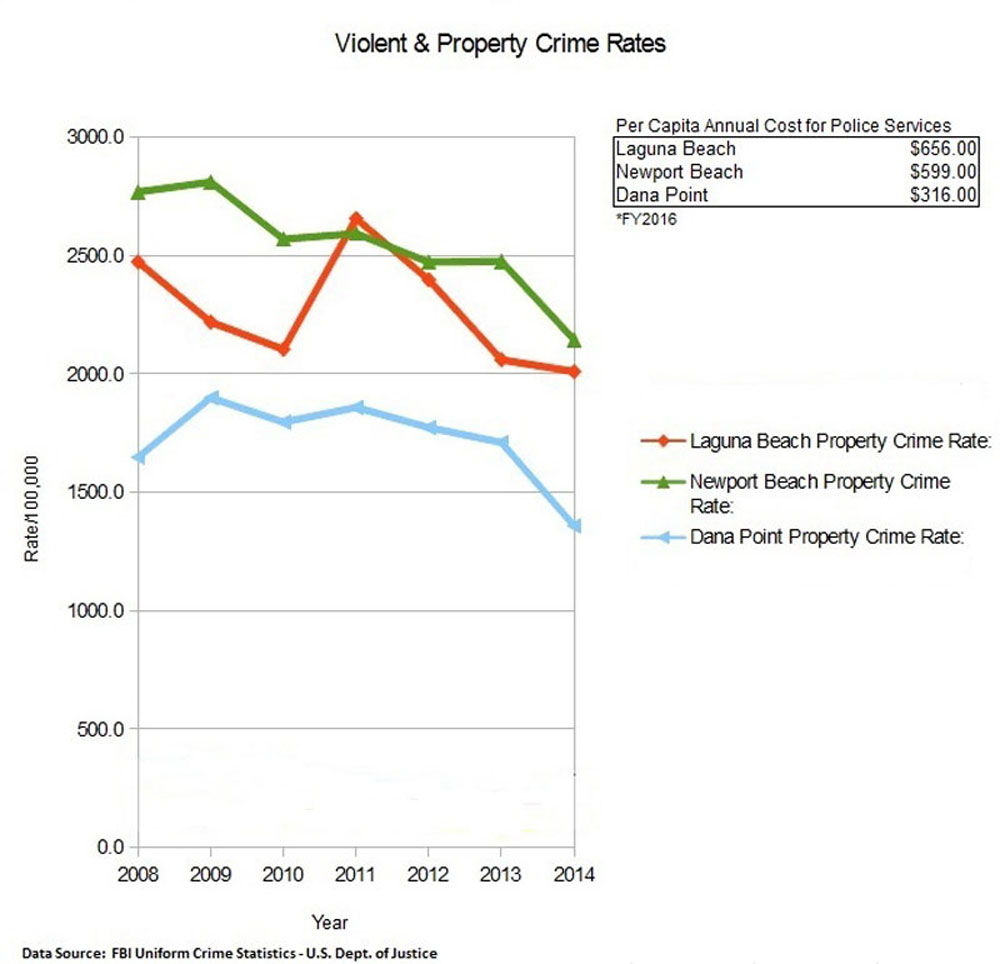
LagunaBeachCHAT analyzed the available property- crime and violent-crime data and compared it with neighboring cities (Newport Beach and Dana Point). We also devised a normalization statistic that allows us to compare public-safety costs per person-day, using the best available data on visitors + residents for each city. That statistic is called “Cost per person-policing day”. The data come from the FBI – Uniform Crime Statistics, U.S. Dept. of Justice and are the most up-to-date that are available.


What we end-up with is a mixed picture. Looking at the Property Crime data (top-chart), we see that Laguna Beach sits between Dana Point on the low-end and Newport on the high-end. The general profile of property-crime rates is very similar for all 3 cities (save for a spike in LB during the 2011 reporting period).
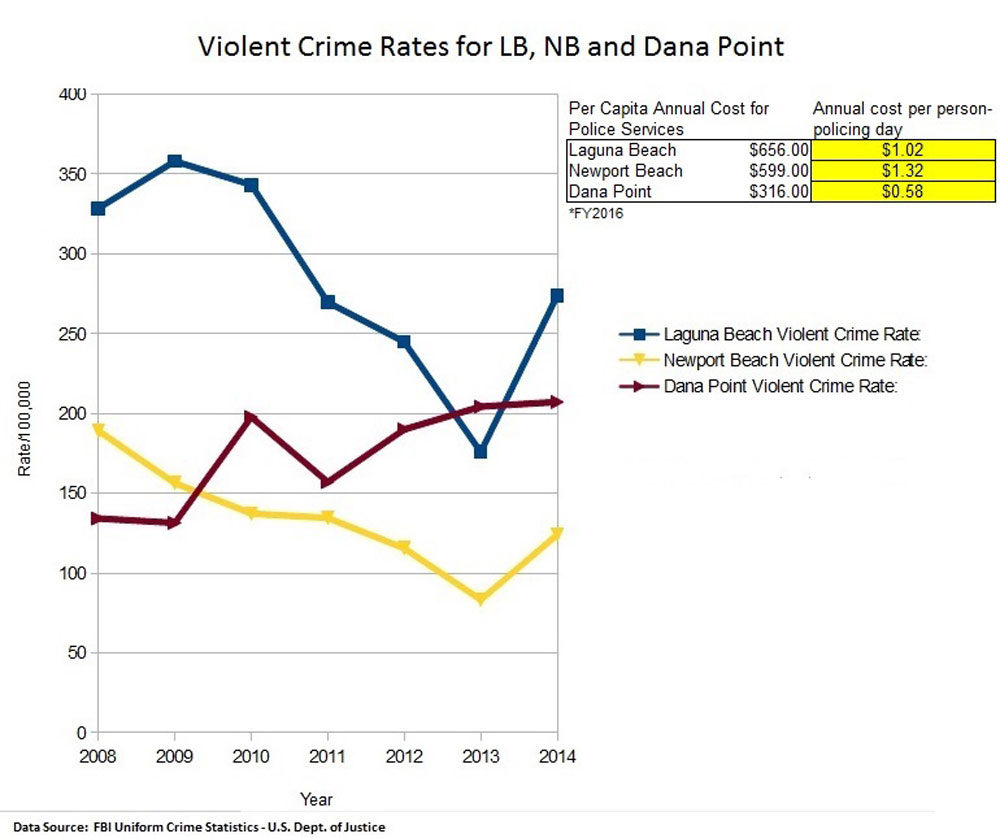
Informal analysis of the violent-crime statistics for all 3 shows a much more erratic picture. Laguna’s violent crime rate seems to have swung wildly from an extreme high in 2009 to an encouraging low in 2013 with an ominous spike in 2014. Somewhat surprisingly, Newport’s violent crime rate is far lower than either LB’s or Dana Points for most of the reporting period.
A final thought about costs. We created the “Annual Cost per Person-Policing Day” metric to try to account for the total person-days each city experiences during the course of a year. We used the best available city-resident + annual-tourist numbers that we could obtain from each city. We consider the tourist numbers suspect, because there is no formal methodology reported, about how the numbers are determined, and the entities collecting/reporting the numbers vary from the cities themselves, to respective tourist-bureaus. But assuming the annual visitor data reported for each city is relatively accurate, we can see that NB actually spends the most for police services annually per person-policing day, followed by Laguna. Dana Point’s numbers are substantially lower, since that city contracts with the County Sheriff for their policing services, and the city doesn’t incur the same level of pension-benefits costs associated with a local city police force.